The Deadline
Sunday Macro Update | April 5, 2026

First, A Correction!
Before anything else, I owe you a correction from last week’s post.
I wrote that SPY, QQQ, and DIA were approaching death crosses on their daily charts. That was wrong. What actually happened was the 21 EMA (the blue line on my charts) crossed below the 200 SMA (the red line). A death cross is specifically the 50-day moving average crossing below the 200-day. That hasn’t happened yet. The 50 SMA (the yellow line) is still above the 200 SMA on all three indexes.
The 21 EMA crossing below the 200 SMA is still a meaningful signal. It tells you that short-term momentum has deteriorated enough to fall below the long-term average. But it’s not the same thing as a death cross, and I should have been more precise with the terminology. I wanted to personally address it here directly and apologize rather than quietly edit and move on.
Now, on to this week.
The Setup
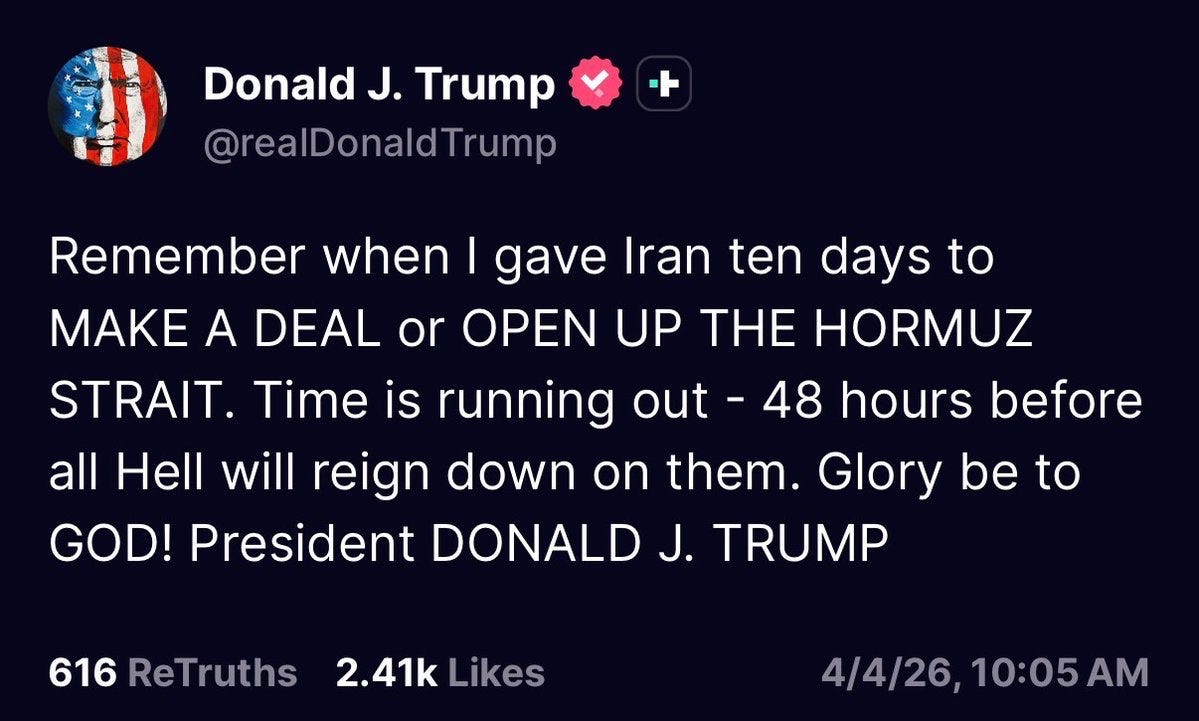
This is being written Saturday evening, April 4. President Trump posted a 48-hour ultimatum to Iran on Truth Social Saturday morning, threatening military action if the Strait of Hormuz is not reopened by Sunday evening. Reports indicate Iran is refusing to negotiate.
WTI crude closed Thursday at $112.06. U.S. futures open Sunday at 6 PM Eastern. By the time you read this, the market may already be reacting.
That context shapes everything in this post. Every chart reading below was taken from Thursday’s close, which is the last trading session before a long weekend with a geopolitical catalyst sitting on top of it. The readings are the baseline. What happens between now and Monday’s open is the variable.
Market Breadth: Improved, But Not Good
$SPXA50R closed the week at 28.7%, up from 19% last week.
That’s a meaningful improvement. More stocks are back above their 50-day moving averages, which means the indiscriminate selling that defined March is easing. But 28.7% is still below 30%, which means less than a third of the S&P 500 is in a short-term uptrend. The selling is less severe. It’s not over.
$SPXA200R is at 48.3%, up from 43% last week. Still below 50%.
That 50% level matters. When more than half the index components are below their 200-day averages, the majority of stocks are in longer-term downtrends. We’re right at the threshold. A push above 50% would be the first concrete sign that the longer-term damage is starting to repair.
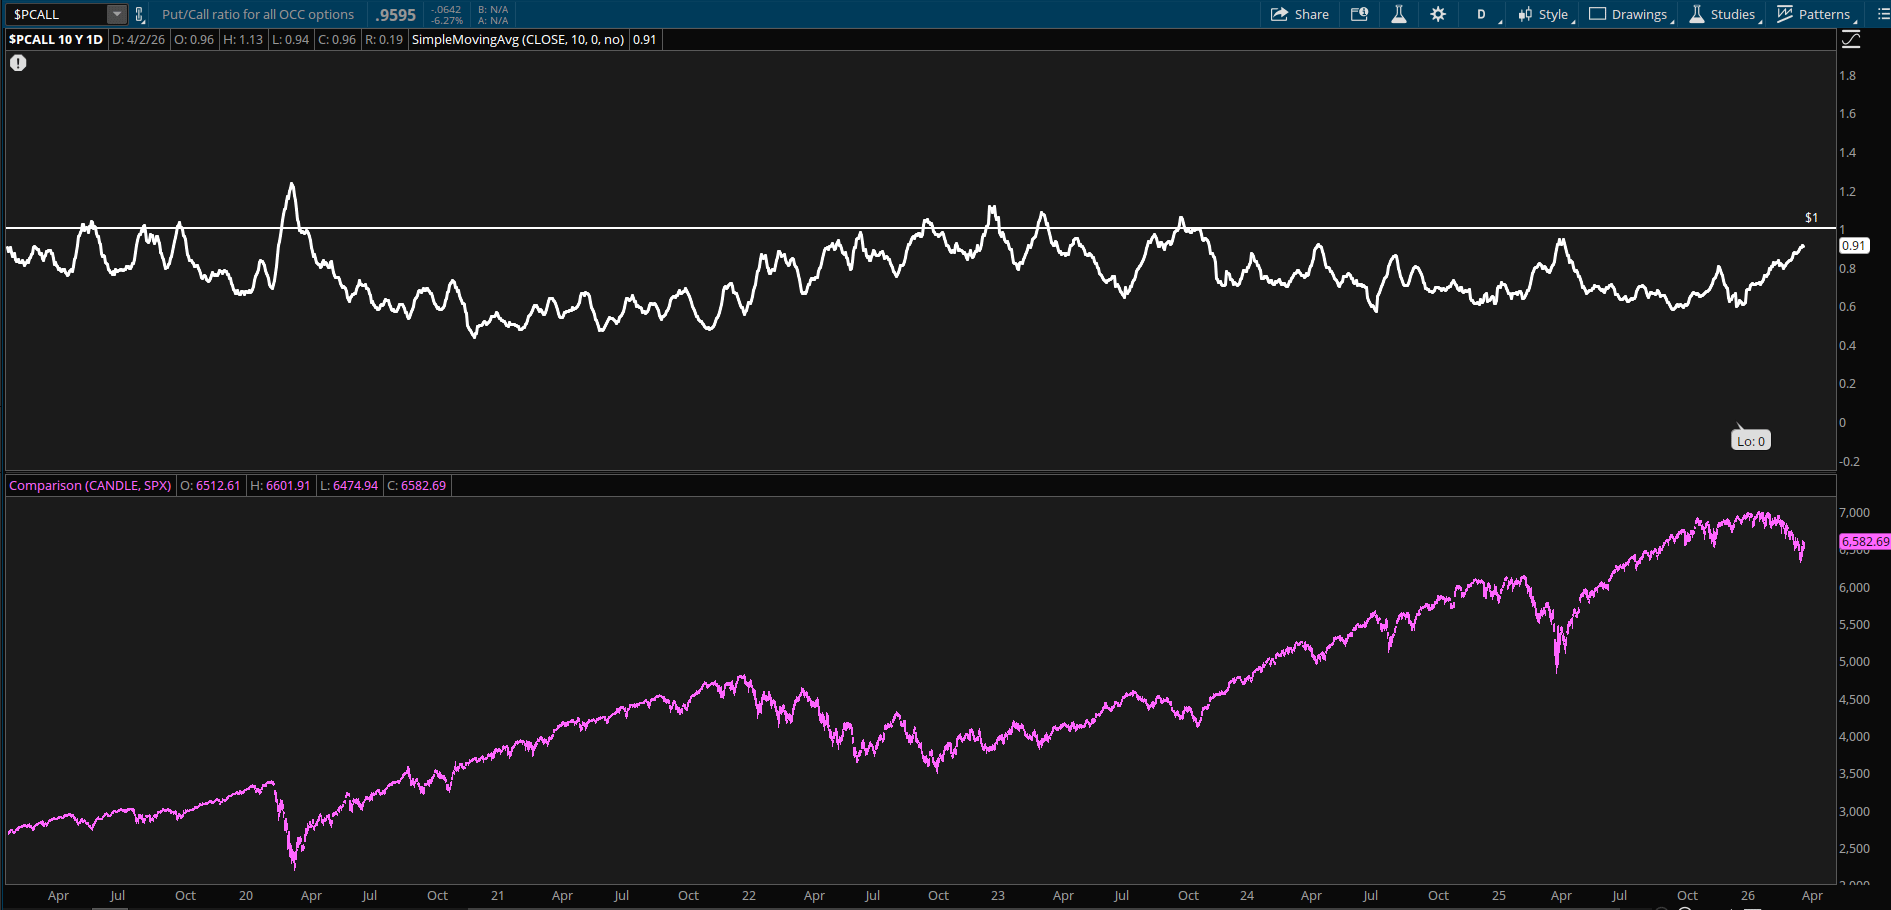
$PCALL with SPX overlay showing the 10-period SMA at 0.91 and recent spike above 1.0
One more data point worth seeing. The put/call ratio ($PCALL) spiked above 1.0 earlier this week before pulling back to 0.96. The 10-period moving average is at 0.91 and rising (this is the top portion of the chart above). A put/call ratio above 1.0 means options traders are buying more puts than calls. The last time that happened in a sustained way was during the COVID crash in 2020. It’s a measure of fear, and fear is elevated at levels we haven’t seen in years. Historically, extreme put/call readings don’t mark exact bottoms, but they do tend to precede periods of short-term relief as the most aggressive bearish bets get squeezed.
The Indexes: Below the Line
$SPY closed at $655.83. $QQQ closed at $584.98. Both are trading below their 200-day moving averages.
If you only take one thing from this section, make it that. The 200-day moving average is the line most investors watch as the dividing line between a market that’s correcting within an uptrend and a market that’s in real trouble. $SPY is almost $7 below its 200-day average at $662.58. $QQQ is about $10 below its at $594.95, and it’s also broken below its prior support at $594.76. Both indexes have their short-term (blue) and intermediate (yellow) moving averages stacked above current price and falling. All three lines are now overhead resistance.
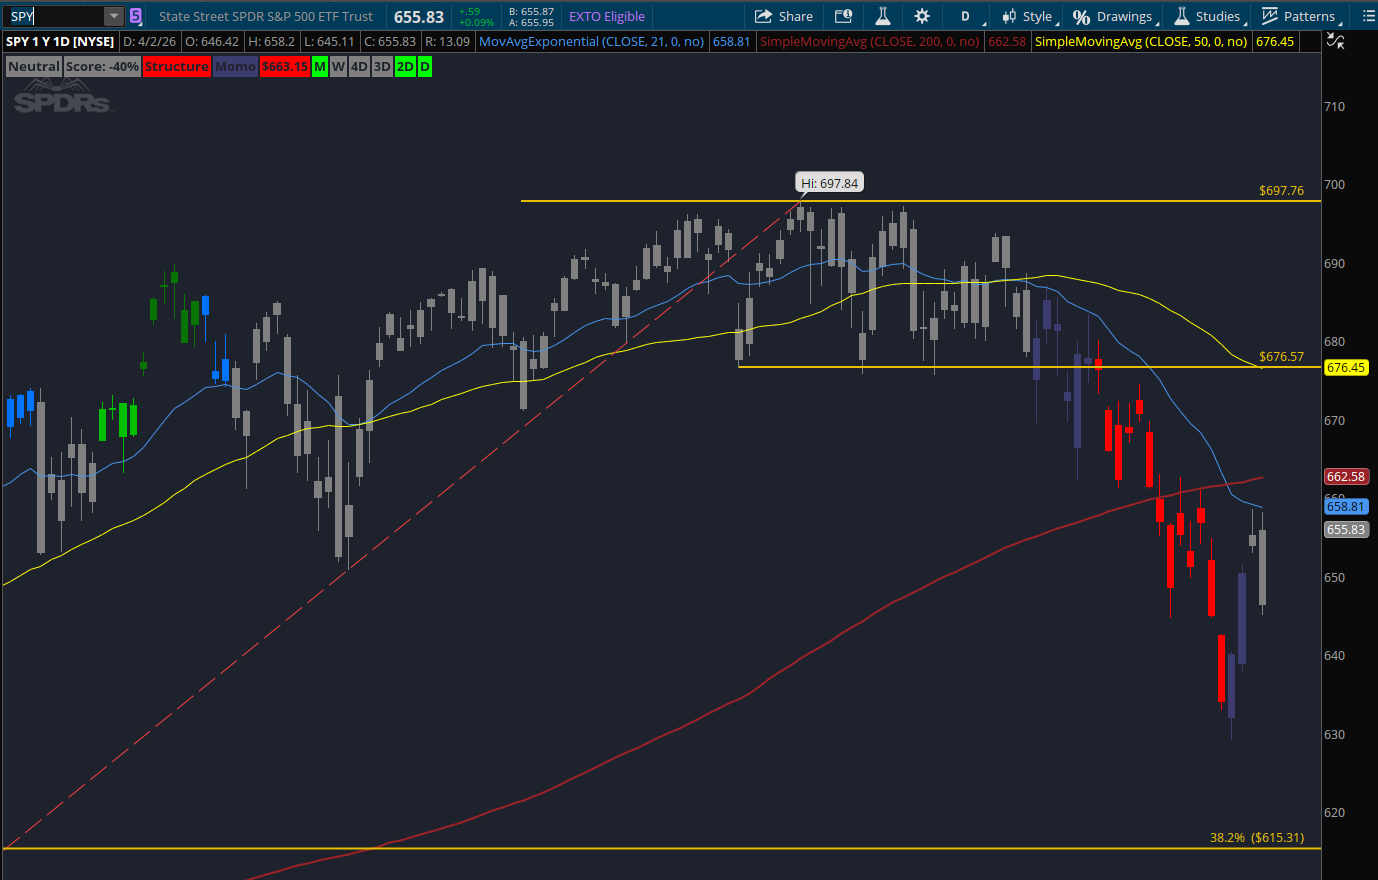
$SPY daily showing price below the 200 SMA (red) with the 21 EMA (blue) and 50 SMA (yellow) above and descending
DIA closed at $465.06 with a score of -65% on the daily, the worst of the four indexes. The 38.2% Fibonacci retracement at $452.21 is only $13 below. DIA has been the structurally weakest index for weeks and that hasn’t changed.
IWM at $251.29 is the relative bright spot. It’s the only major index still above its 200-day moving average at $242.84. Price is sitting on the 50-day average at $249.88 with some constructive signals underneath that the other three indexes don’t have. Small caps are showing more resilience than large caps, which is an interesting development given that small caps led the decline earlier in this correction.
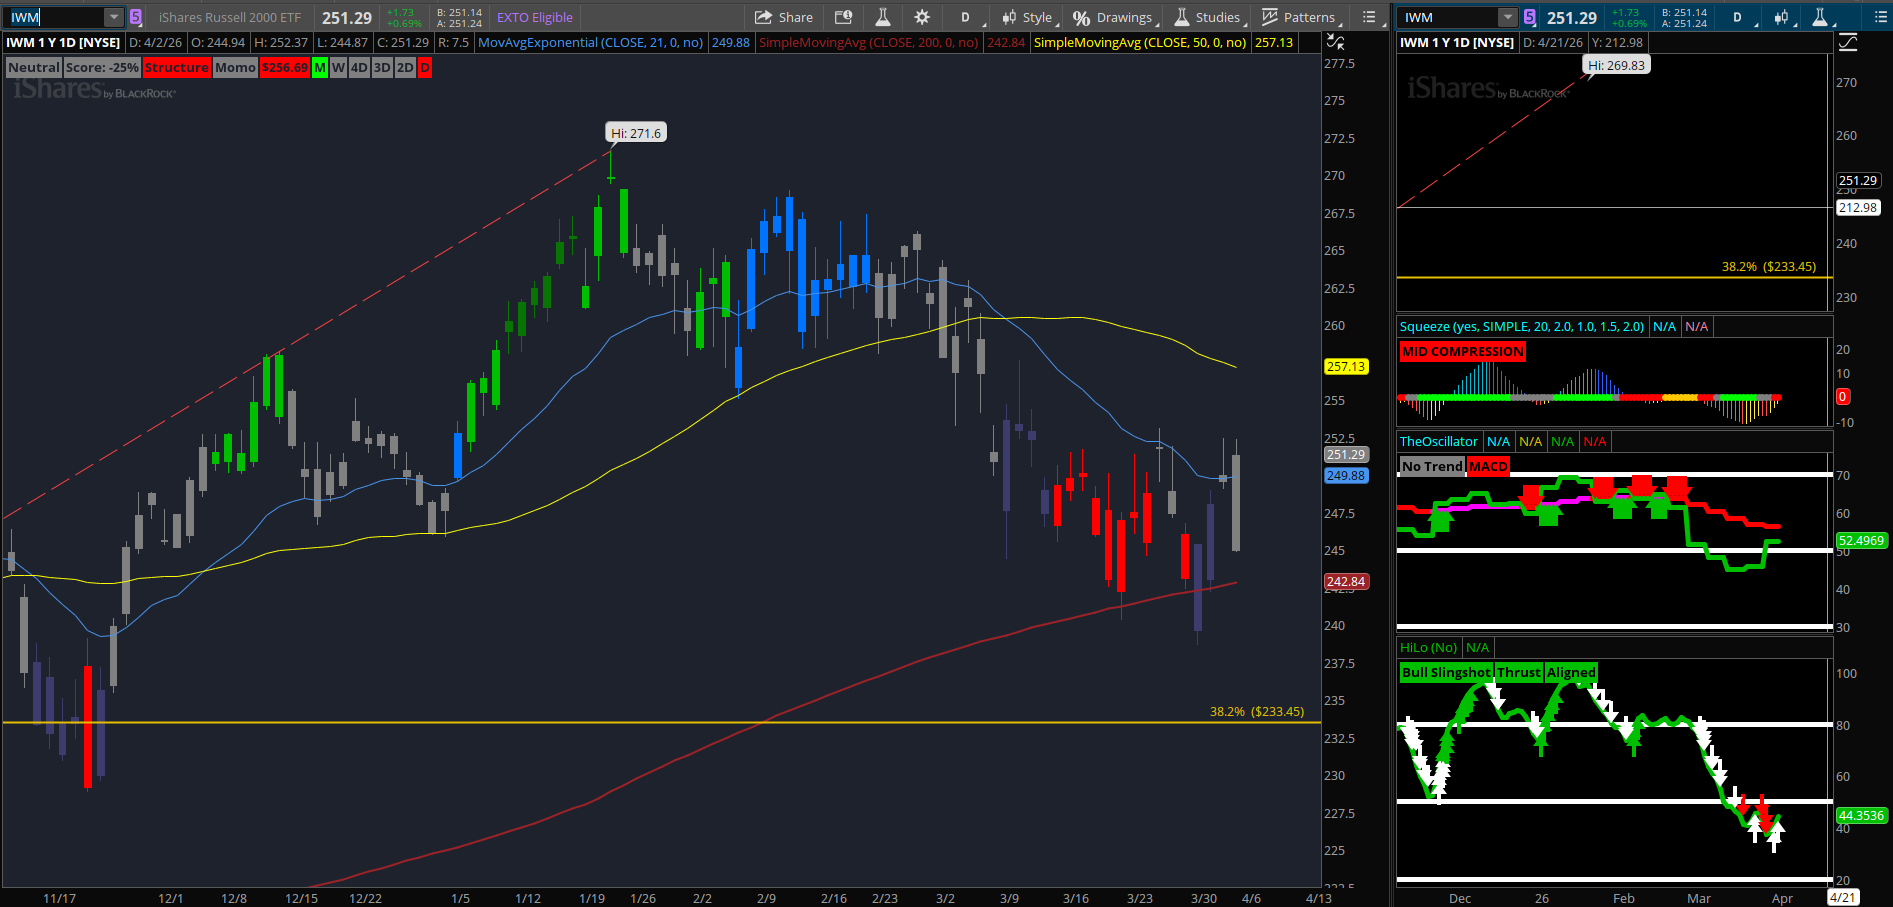
$IWM daily showing price on the 50 SMA with the Bull Slingshot signal and MID COMPRESSION
Last week’s post discussed the 21 EMA crossing below the 200 SMA on SPY, QQQ, and DIA. That’s the corrected framing from the note above. The formal death cross (50-day crossing below the 200-day) still hasn’t occurred, but the 50-day is descending on all three. If the selling continues, that cross eventually follows. It’s a risk on the horizon, not a current event.
Crude Oil and the 48-Hour Clock
WTI crude closed Thursday at $112.06. The daily chart is at Max Bull with a squeeze building and a Bull Slingshot signal confirmed. The momentum indicators show the widest bullish gap of any instrument in this entire review.
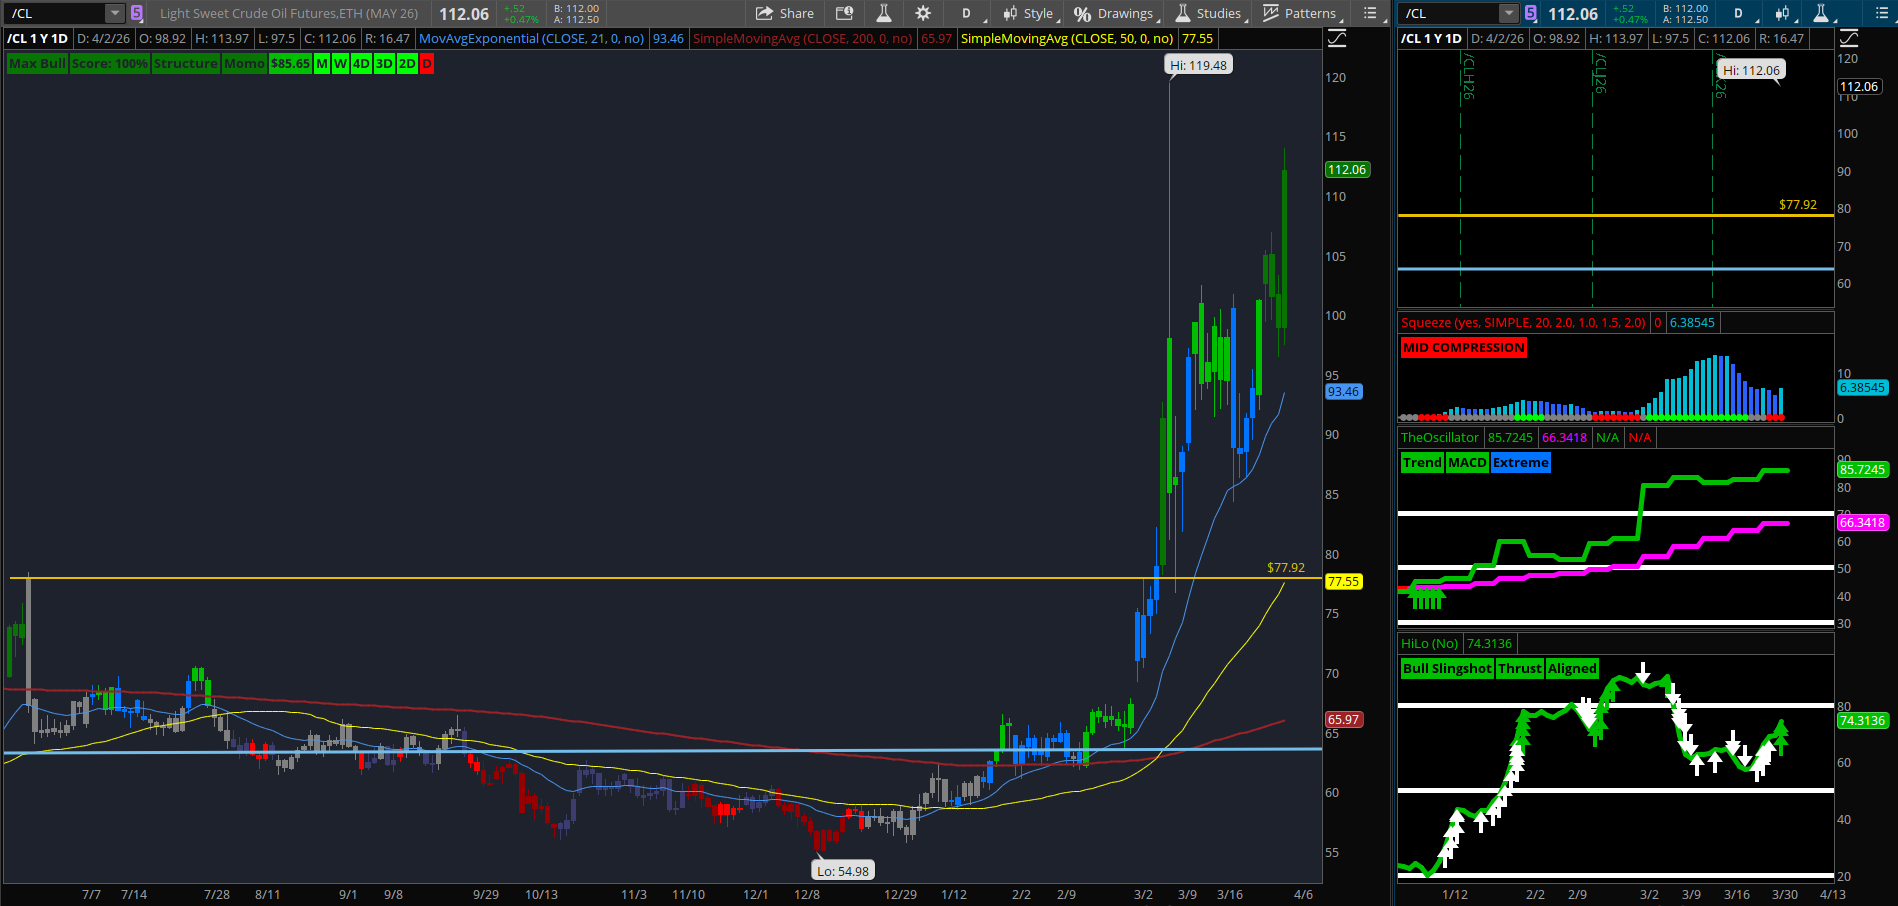
Crude /CL daily showing Max Bull, MID COMPRESSION with blue histogram, and Bull Slingshot]
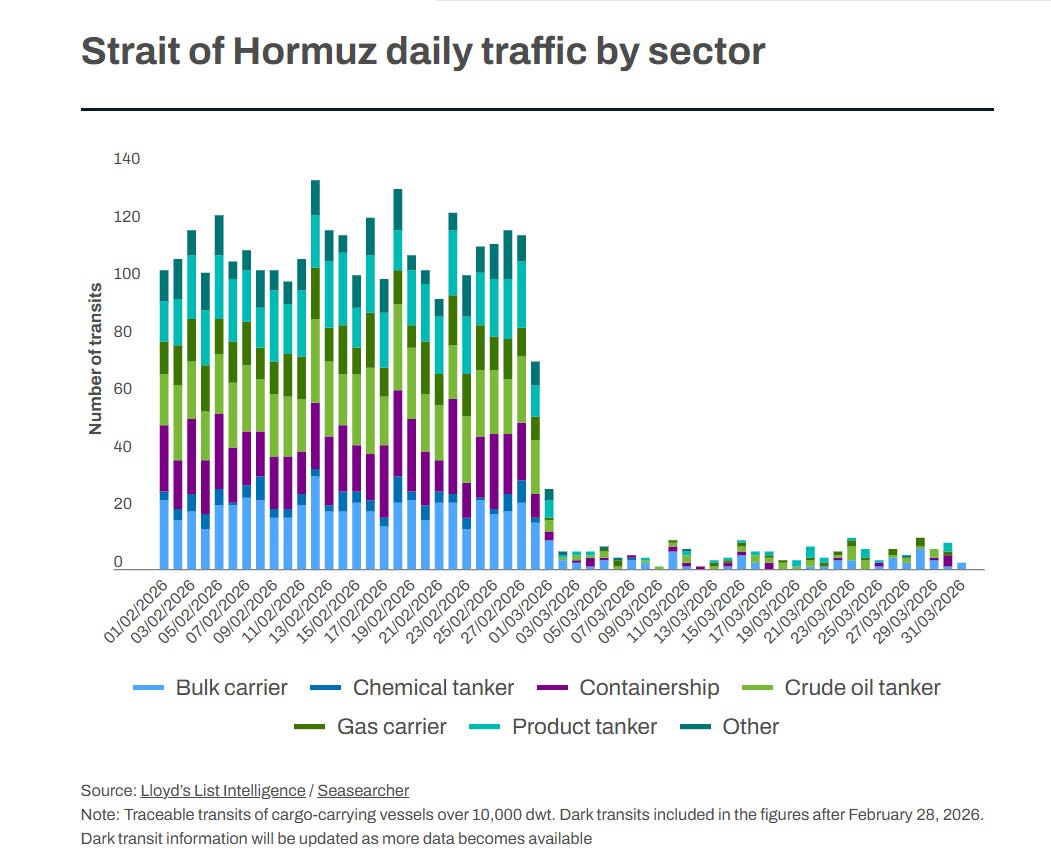
The Strait of Hormuz has been effectively closed since early in the war. About one-fifth of global petroleum trade normally passes through it. President Trump’s 48-hour ultimatum, combined with reports that Iran is refusing to negotiate, means Sunday night’s futures open could be volatile. If military action follows the deadline, crude likely gaps higher toward or above the $119.48 prior high. If a last-minute deal materializes, the war premium unwinds and energy names give back gains.
This is the binary catalyst I have been tracking since March. $XLE closed at $59.25, down from $63+ the prior week, and the hourly chart showed the first real crack in the energy story on Thursday. $OIH showed the same pattern. The weekly trends on both are still strongly bullish, but the hourly deterioration was notable. Whether that was a normal pullback in a bull trend or the start of something more depends entirely on what happens this weekend.
A Tariff Reshuffle
Thursday also brought changes to the administration’s metals tariffs, announced on the one-year anniversary of Liberation Day. The restructuring simplifies how tariffs are applied to steel, aluminum, and copper.
Products made entirely of those metals still face 50% tariffs. Products containing a significant amount pay a flat 25%. Products with less than 15% metal content by weight are exempt from the metals tariff entirely. The administration also closed a loophole where exporters were artificially lowering the declared value of imported metals to reduce the tariff amount.
For the charts, this matters most for $XLB (materials), $COPX (copper miners), and $XLI (industrials). $XLB was one of only two sectors trading above all its moving averages this week. Higher metals tariffs are a double-edged sword: good for domestic producers, bad for domestic manufacturers who use steel, aluminum, and copper as inputs. $ITB (homebuilders), already the worst chart in this review, falls squarely in the “uses metals as inputs” category.
The addition of copper to the Section 232 tariff umbrella is new and adds a layer of risk to the electrification and battery themes that support $LIT and $COPX.
Credit Situation: Remains the Same
$HYG closed at $79.56. Still below $80. Its eighth consecutive week.
The 21-day and 50-day moving averages are both sitting right at the $80 level, clustered together with price just below. Every rally attempt into that zone has failed. The short-term chart shows another attempt building, but the pattern of rejection at $80 has been consistent enough that it deserves more respect than any single day’s bounce.
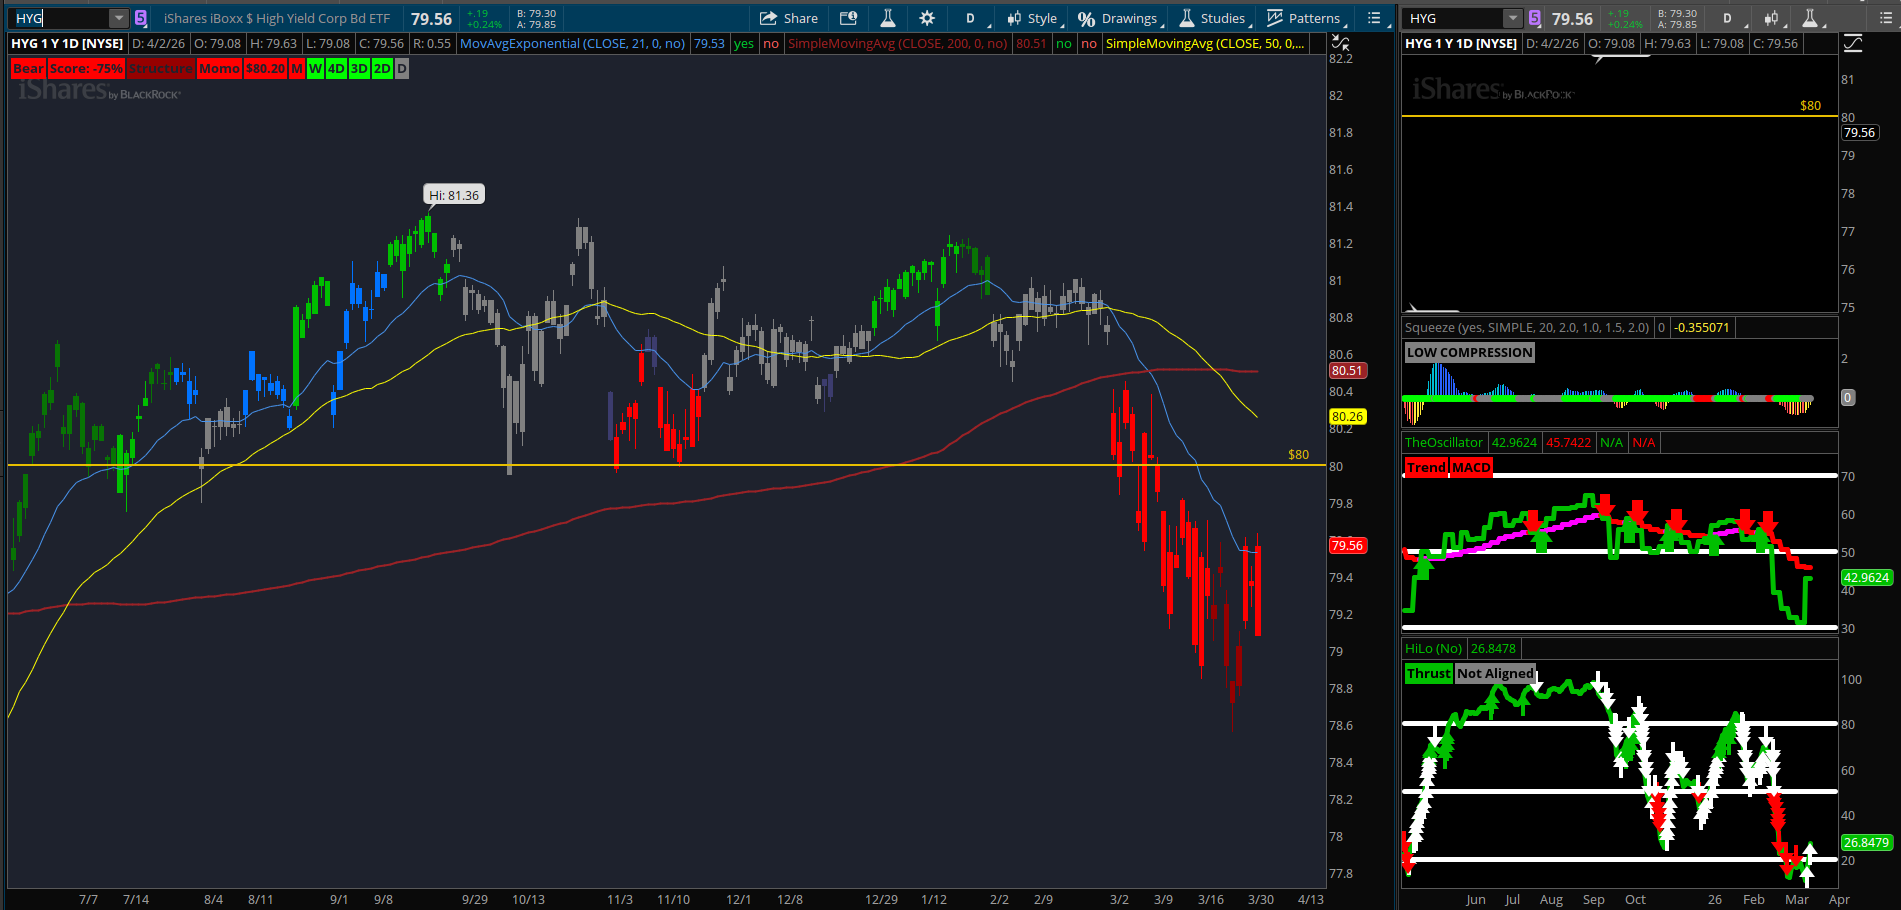
$HYG daily showing price below $80 with the LOW COMPRESSION and all MAs clustered at the $80 threshold
$LQD (investment-grade bonds) confirmed the same story. Daily bear reading with a weekly Bear Slingshot signal active. When both high-yield and investment-grade credit are in daily bear trends with bearish weekly signals, the credit picture is genuinely stressed. This isn’t just a junk bond problem.
$TLT (long-term Treasuries) closed at $86.79, only $1.28 above the $85.51 floor we’ve been tracking for weeks. The daily is at Max Bear. Bonds are still falling alongside stocks. That pattern, both stocks and bonds losing value at the same time, tells you this isn’t a normal correction. In a normal sell-off, money flows from stocks into bonds for safety. When both are falling, it means something else is driving the selling, and right now that something is a combination of inflation expectations, rate uncertainty, and geopolitical risk.
The Dollar
$DXY closed at $100.013. The $100 level has been the thesis gate for the real assets trade since the beginning of my substack analysis. Last week the dollar was above it. This week it’s right at it.
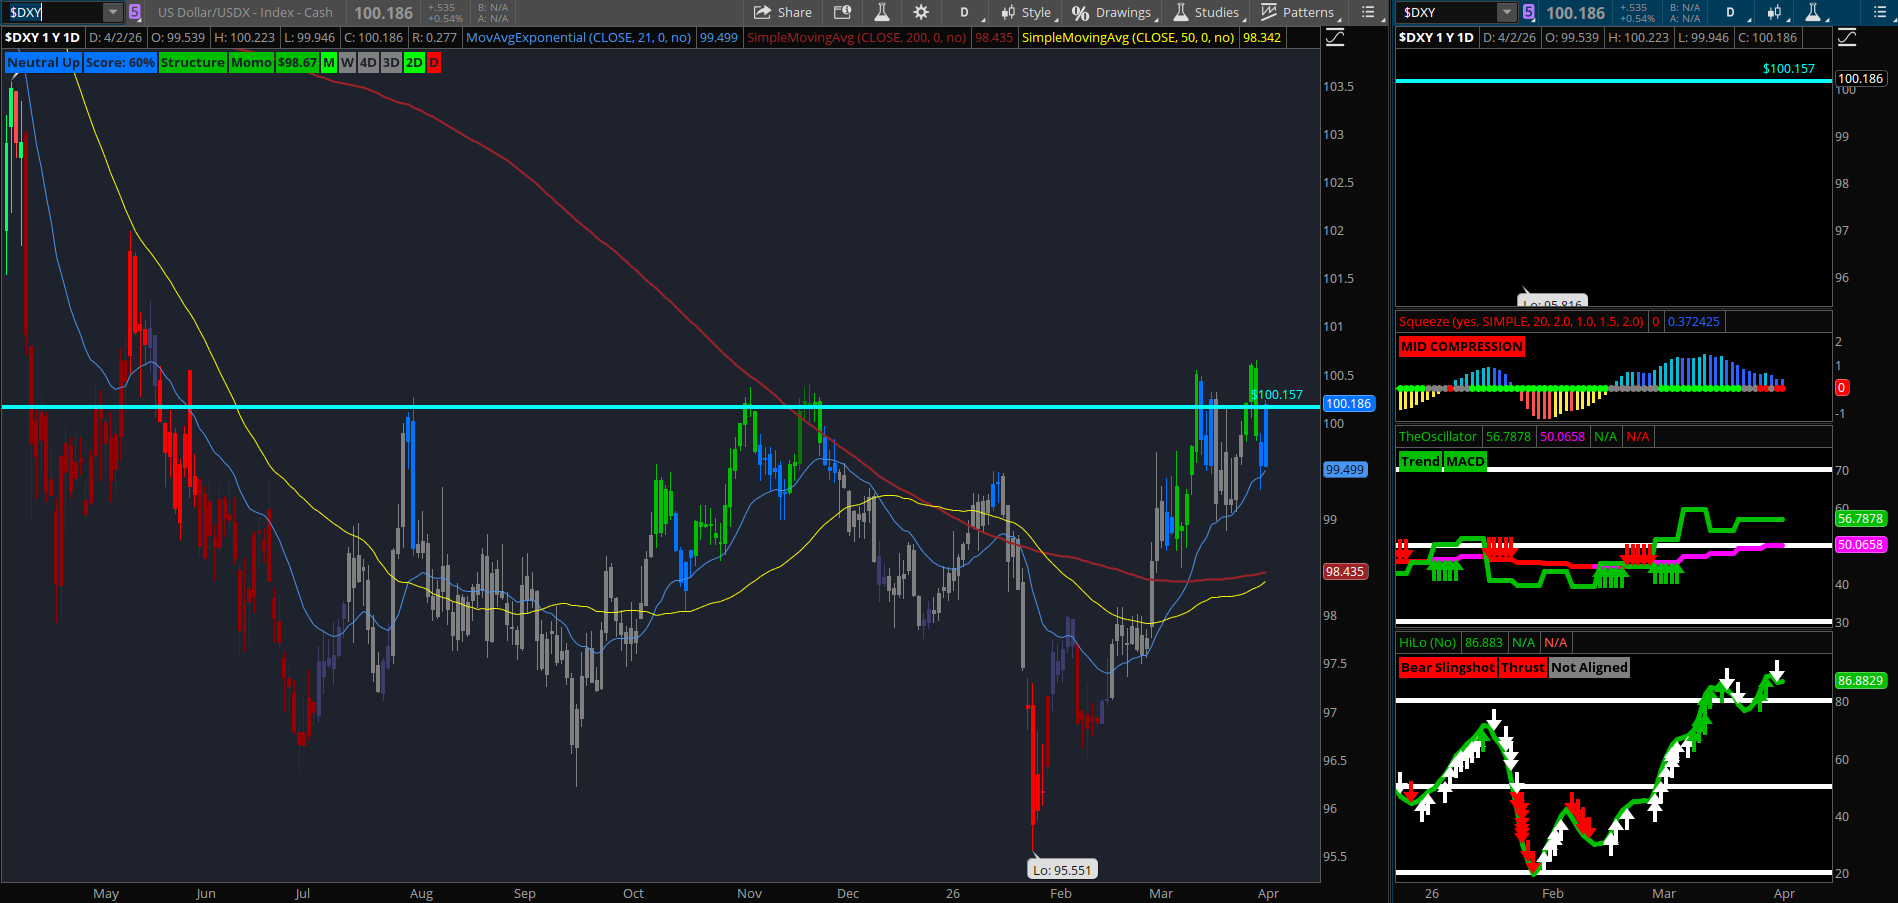
$DXY daily showing price at $100.013 right below the $100 gate with the MID COMPRESSION
The daily chart has a squeeze building with the momentum histogram sitting right at zero. The direction of the next move matters for everything downstream. Gold, silver, copper, emerging markets, and the entire commodities complex are directly tied to what the dollar does here.
If $DXY falls through $100, the real assets thesis gets its oxygen back. If it holds above, the pressure on gold, $EEM, and $COPX continues. The squeeze on the daily hasn’t fired yet. When it does, you’ll know which way to lean.
The Sector Map
Out of eleven SPDR sector ETFs, two are trading above all their moving averages: XLE (Energy) and XLU (utilities). Everything else is below at least one, and most are below all three on the daily chart.
XLY (consumer discretionary) is the worst sector. Daily score at Max Bear, the lowest possible reading, with bear alignment across the weekly, daily, and hourly charts. Price is trading below the 21-EMA with the 50% Fibonacci retracement right below at $105.78.
XLF (financials) is at the 21-EMA with a squeeze building on the daily. A break lower targets the 61.8% Fibonacci at $47.67. Financials breaking down connects directly to the HYG story above.
XLK (technology) has squeezes building on both the weekly and daily charts with bearish momentum. If those fire, the 38.2% Fibonacci at $127.49 is the target. Tech is still structurally broken.
Defensive sectors such as the XLP (Consumer Staples) are holding on to their daily 200-moving average. XLV (Health Care) is wedged between its 50-day and 200-day simple moving averages. Both have bearish weekly signals and are trading below their intermediate moving averages. XLU is the only defensive holding above its averages.
The Standouts
UFO (space and defense) is the strongest chart in the entire review. Max Bull on the weekly and hourly, making new all-time highs while the rest of the market falls apart. The daily has a squeeze building with positive momentum. Defense spending is a real theme and it’s showing up in the chart. If you’re looking for where money is actually flowing right now, it’s here.
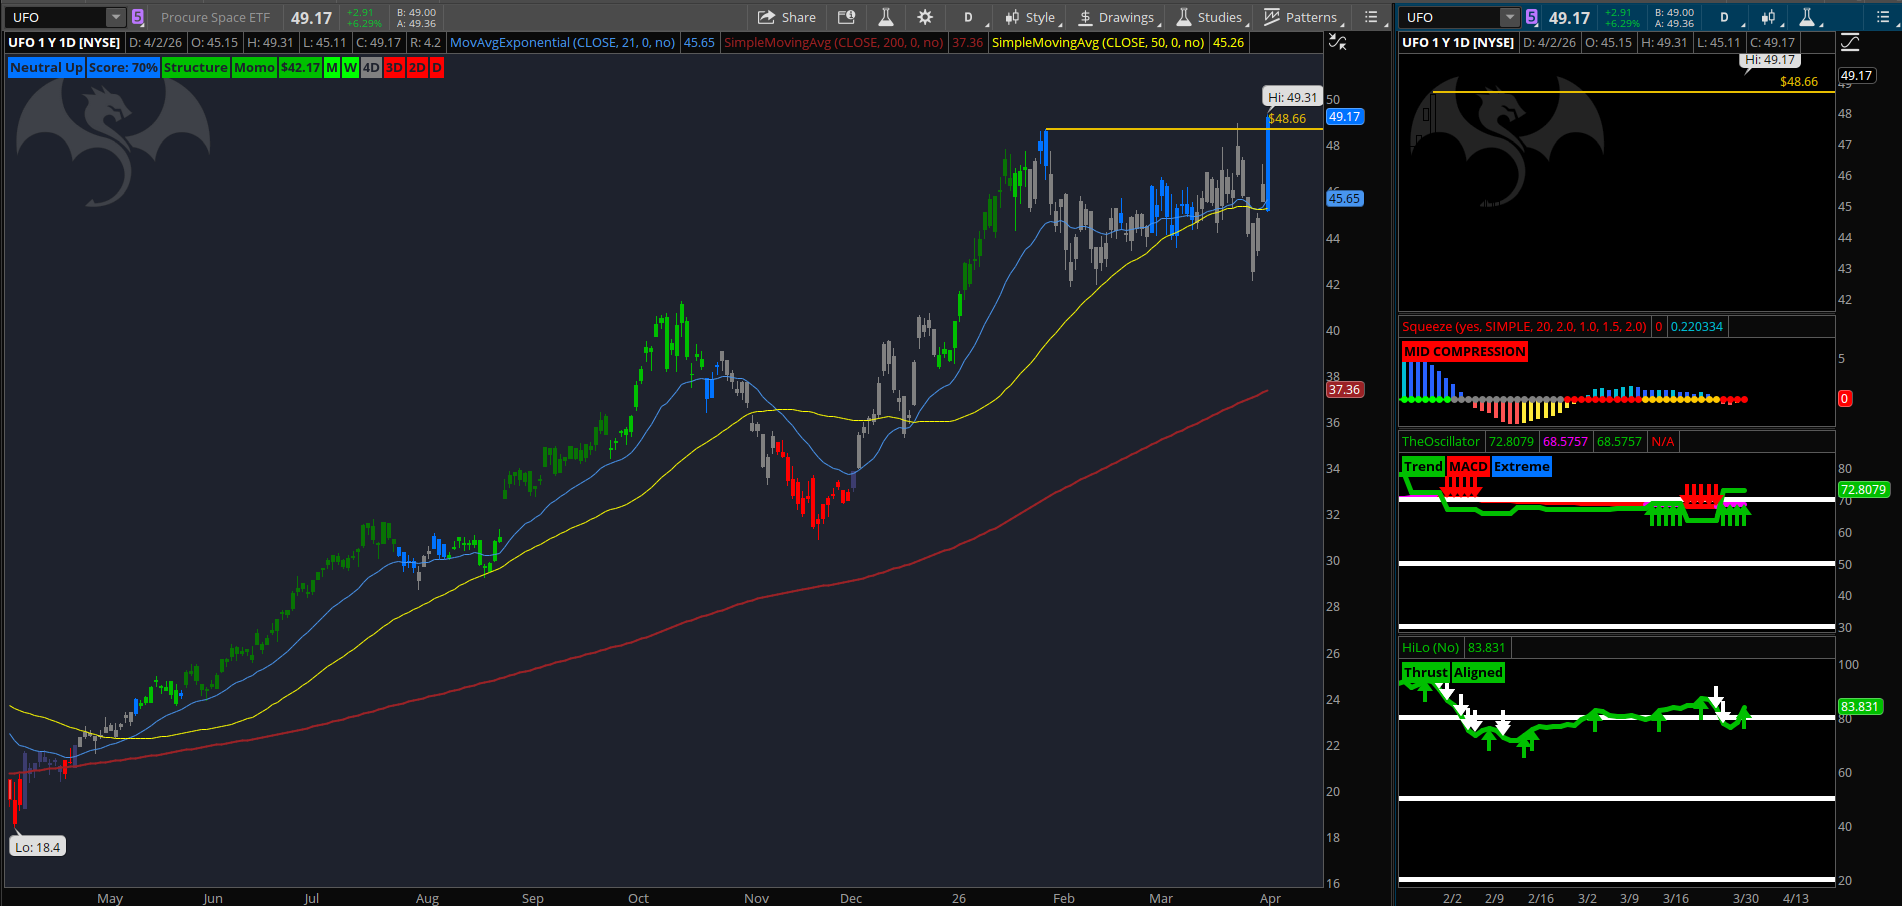
The UFO ETF looks strong! Best Holdings within this ETF are: PL, SATS, GSAT, VSAT
LIT (lithium/battery tech) is one of the better setups. Weekly bull reading, daily has a Bull Slingshot signal with a squeeze building and positive momentum. Price above all moving averages on every timeframe. The tariff risk on copper and the China exposure are real, but the chart hasn’t priced those in yet.
IGV (software) remains one of the worst charts. Weekly bear at -85% with the lowest momentum readings in the batch. Price near the 200-day average with the $74.31 level as the next support. Software has been broken for weeks and nothing has changed.
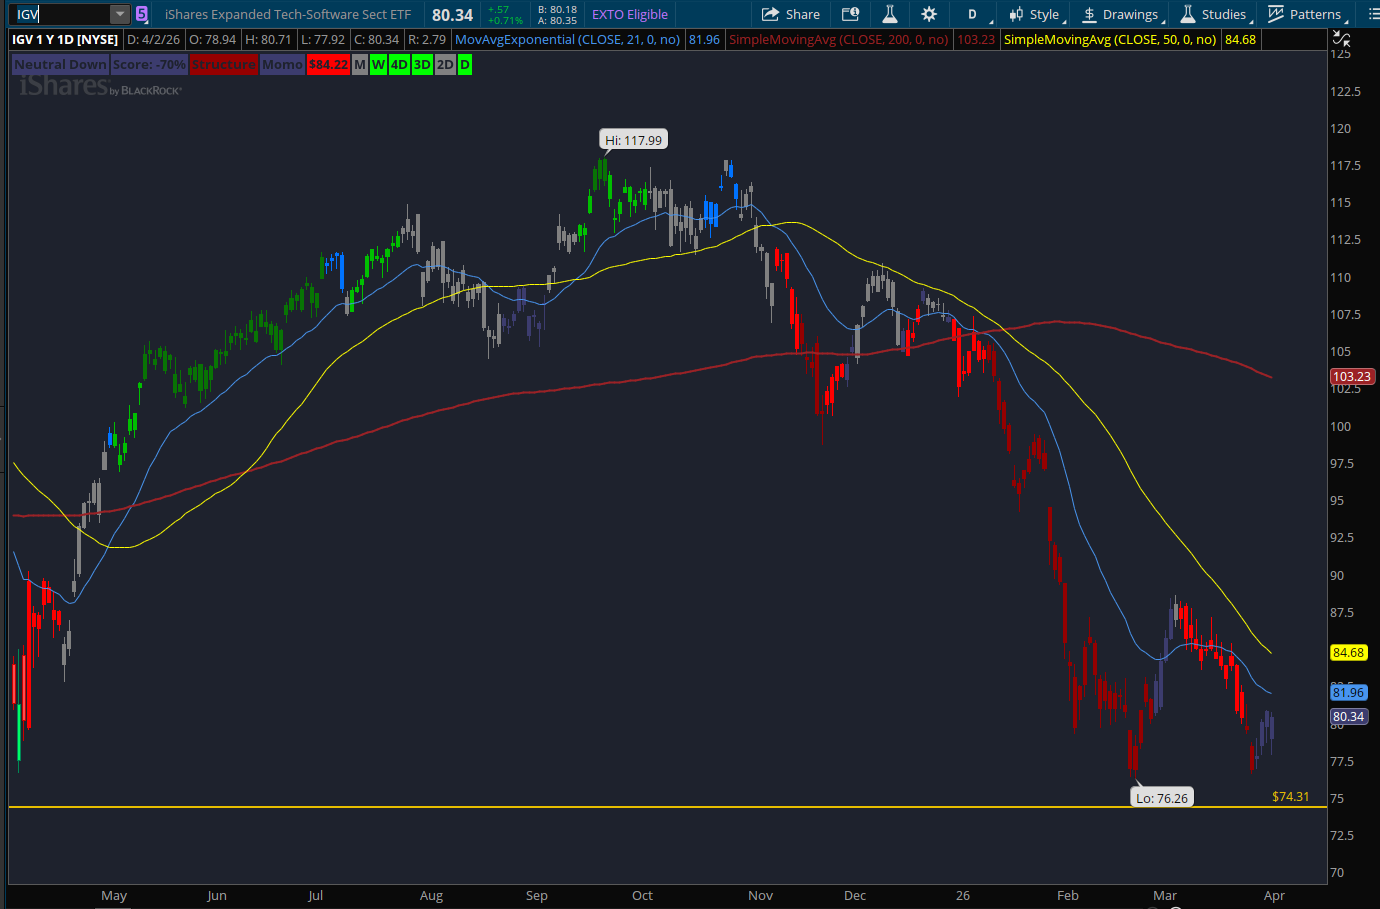
Software ETF, IGV, is down 32% from its recent all-time high. $74 level could be support
ITB (homebuilders) is the worst chart in the review. Bear alignment across all three timeframes with the most extreme readings of any instrument. Rate pressure from TLT, input cost pressure from metals tariffs, and consumer stress from XLY are all hitting homebuilders simultaneously.
Gold and Silver
GLD closed at $429.41, down from $509+ at the highs. Price is sitting right on the 50-day moving average. The daily momentum reading is the most deeply negative in the entire review, showing the severity of the pullback. But the weekly chart is still constructive with positive momentum and the longer-term trend intact.
This is a pullback in a bull trend on the weekly timeframe, with the daily in correction mode. The $403.30 level is the line in the sand. If the 50-day average holds, this could turn into a buying opportunity. If it breaks, $403 is the next test. The dollar (DXY) is the direct driver.
SLV (silver) got hit harder, down from $109 to $65.79. Also sitting near the 50-day average. Silver is more volatile than gold and the decline reflects that. Same dependency on the dollar.
What To Watch
Everything converges on the same 48-hour window.
Sunday evening futures open at 6 PM Eastern. WTI crude, stock index futures, and the dollar will all react to whatever happens with the Iran ultimatum before then. Monday’s open could be violent in either direction.
The number of instruments with squeezes sitting at zero waiting for a directional trigger is unusual. DXY, VIX, HYG, KRE, IYT, MDY, IWM, XLK, NLR, and Bitcoin all have compressions that haven’t fired. The tariff announcement and the Iran deadline are exactly the kind of catalysts that fire them all at once.
HYG at $80 remains the gating factor for any recovery thesis. Eight weeks below that level. Until credit clears it, bounces don’t have confirmation.
The $PCALL spiking above 1.0 says fear is near historic extremes. Breadth improving from 19% to 28.7% says the worst of the indiscriminate selling may be easing. Those two things together suggest a tradeable bounce is possible if the right catalyst arrives. But a tradeable bounce and a genuine recovery are different things, and the credit market hasn’t given the all-clear for the latter.
Size accordingly. Know your levels. And watch the futures Sunday night.
This analysis uses a proprietary multi-timeframe indicator system combining trend oscillators, stochastic momentum readings, moving average structure scoring, and volatility compression analysis. All readings are based on April 4, 2026, closing prices. Not Financial Advice.